Analogue to Digital Converter (ADC)

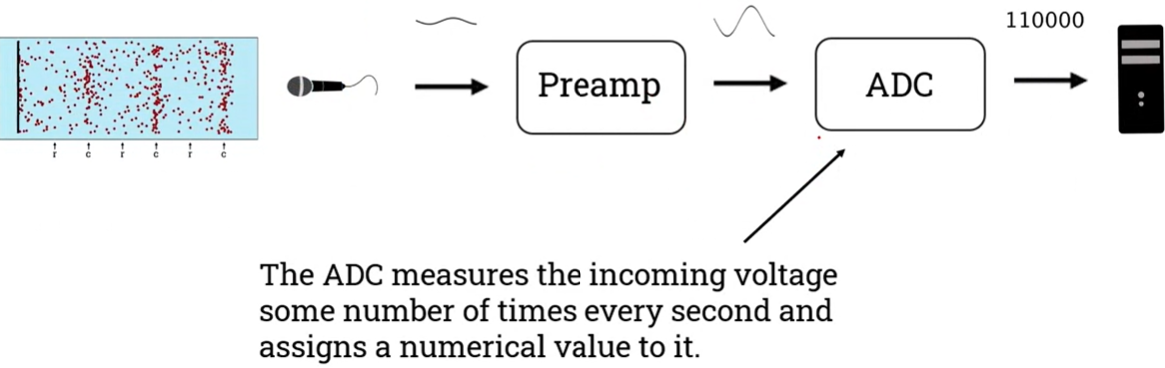
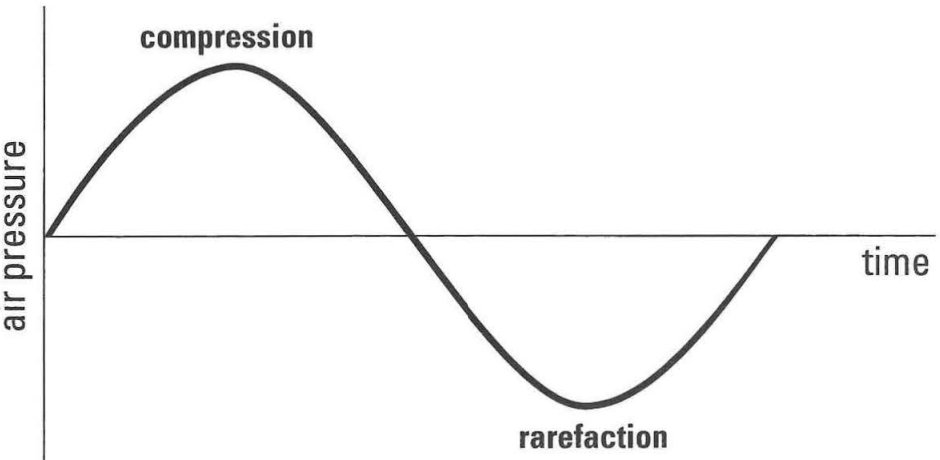
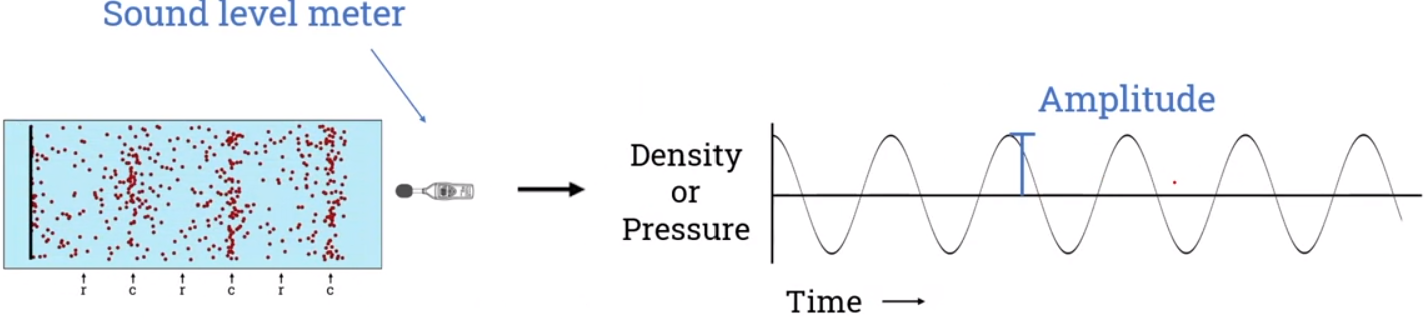
  1. The microphone (transducer) converts air pressure changes into an electrical signal.
  2. The electrical energy generated by a microphone is usually quite small, so we need a device, called a preamplifier, to convert the weak electrical signal generated by the microphone into an output signal strong (larger) enough to be digitised.
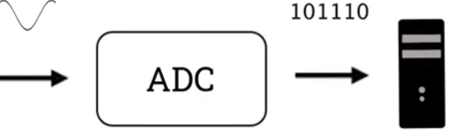
  3. ADC samples incoming analogue voltage at a specific rate and assigns a digital value to each sample. These digital values are then usable by the digital devices.

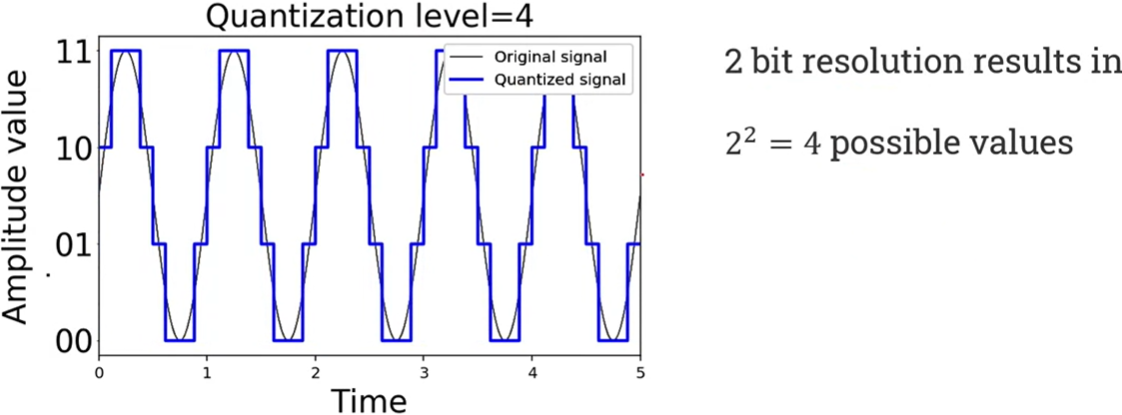
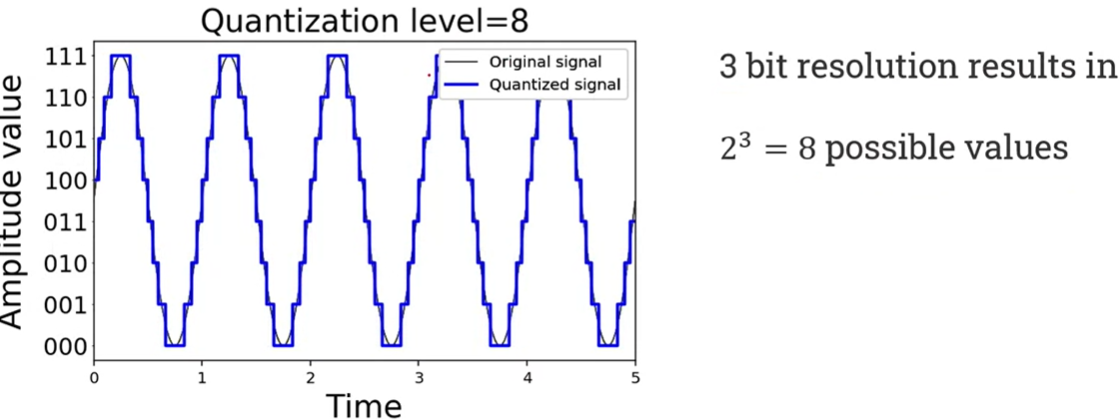
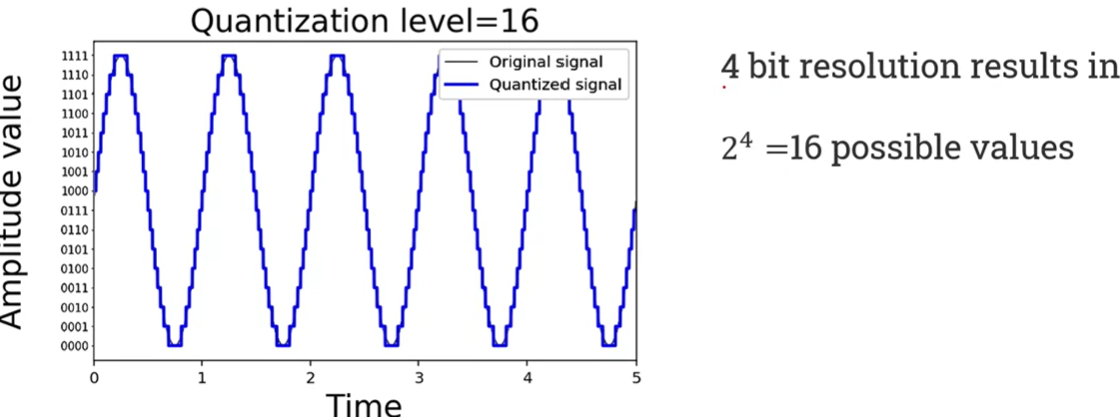
The act of assigning an amplitude value to the sample is called quantising and the number of amplitude values available to the ADC is called the sample resolution.


Once the audio has entered the digital domain, the possibilities for editing, processing, and mixing are nearly endless. When digital audio is played back, the signal is first sent through a DAC.


Digital to Analogue Converter (DAC)

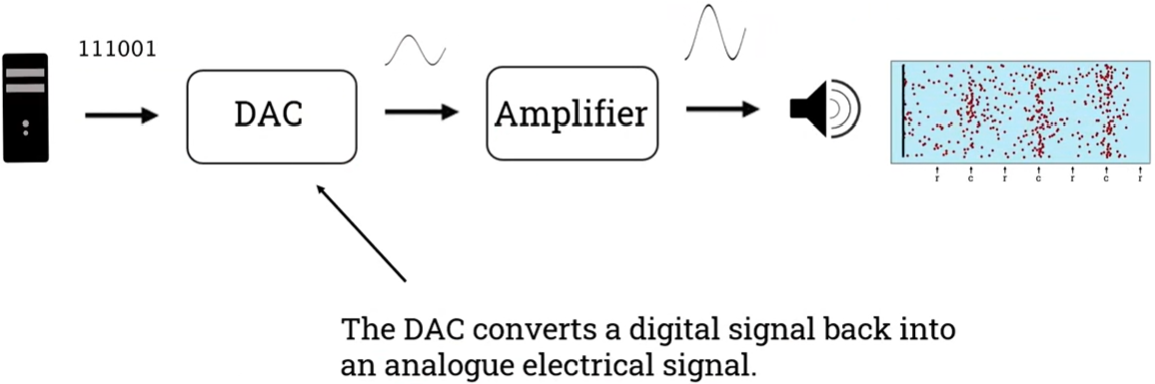
In the opposite case,

  1. DAC converts the digital signal back into an analogue electrical signal.
  2. An amplifier amplifies the level of the signal and sends this signal to a speaker or headphones that will generate the sound wave.

We can perceive the sound wave as a sound. In the context of digital audio playback, the DAC is built into the audio output of the computer or into an audio interface. Some computer speakers connect directly to the computer via USB and therefore have DACs built into them.


Audio recording path summary

  1. Vibrations in the air are converted to an analogue electrical signal by a microphone.
  2. The microphone signal is increased by a preamplifier.
  3. The preamplifier signal is converted to a digital signal by an ADC.
  4. The digital signal is stored, edited, processed, mixed, and mastered in software.
  5. The digital signal is played back and converted to an analogue electrical signal by a DAC.
  6. The analogue electrical signal is made larger by an amplifier.
  7. The output of the amplifier is converted into vibrations in the air by a loudspeaker.


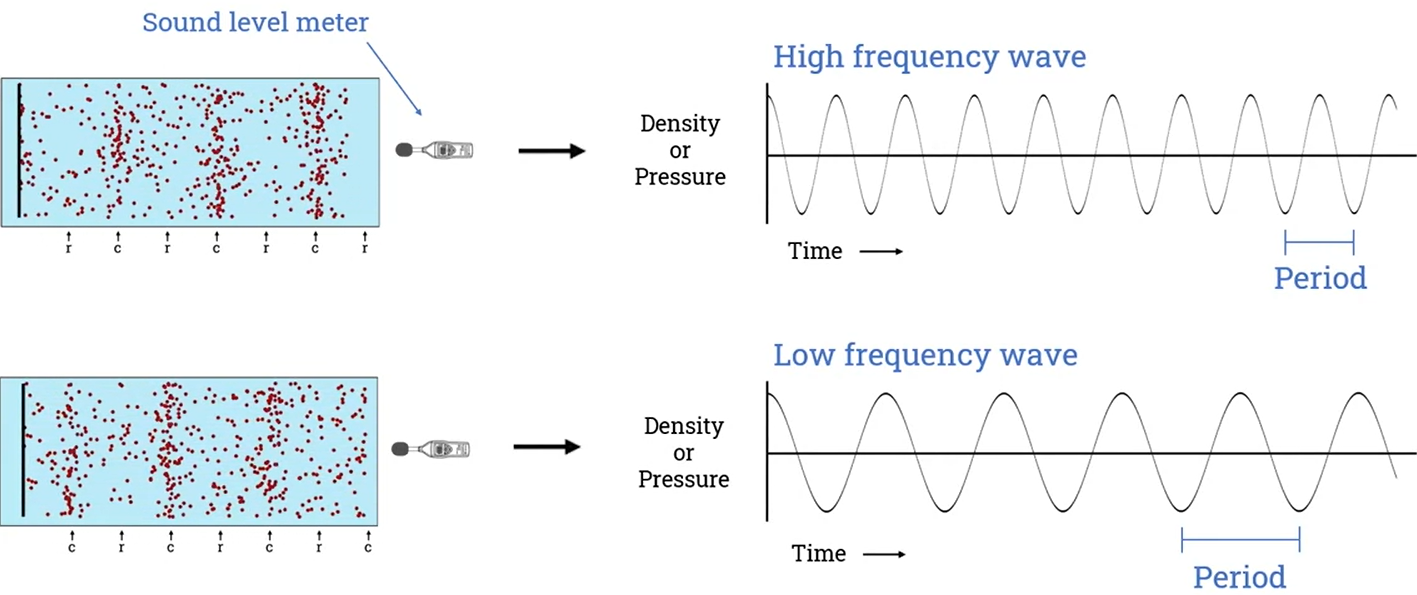
Sampling rate (frequency)

  • Each measurement of the waveform's amplitude is called a sample.
  • The number of measurements (samples) taken per second is called the sampling rate (Hz).

The faster we sample the better the quality, but the more samples we take the more memory size we need.


The Nyquist-Shannon sampling theorem

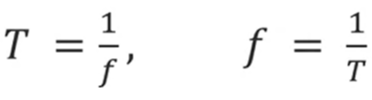
The Nyquist theorem defines the minimum sample rate for the highest frequency that we want to measure. The Nyquist frequency, also called the Nyquist limit, is the sample rate divided by two.

  • This theorem says that the signal above the Nyquist frequency is not recorded properly by ADCs, introducing artificial frequencies in a process called aliasing. If the Nyquist theorem is not obeyed, higher frequency information is recorded in too low a sample rate, resulting in aliasing artefacts.
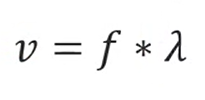
  • The sampling rate must be at least twice the frequency of the signal being sampled.

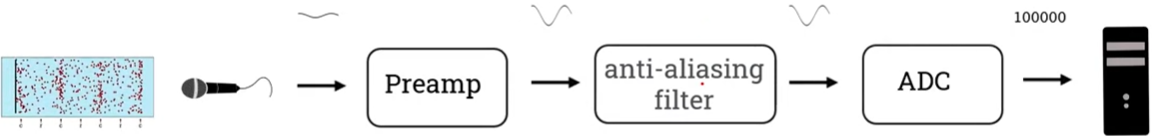
An anti-aliasing filter is a low-pass filter that eliminates frequencies above the Nyquist frequency before audio reaches the ADC.


Bit depth

  • Bit depth, also known as sample width and quantisation level, is the number of bits used to record the amplitude measurements.
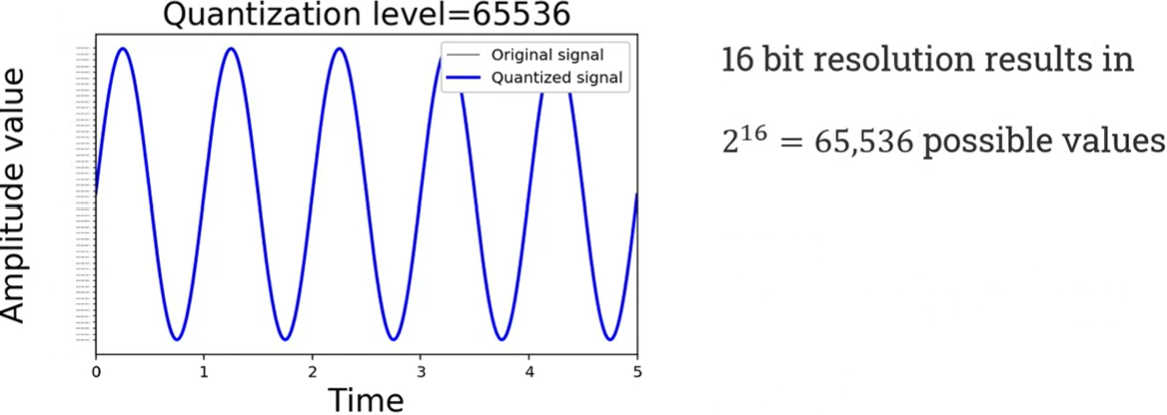
  • The more bits we use, the more accurately we can measure the analogue waveform and the more hard disk space or memory size we need.

Common bit widths used for digital sound representation are 8, 16, 24, and 32 bits.

더보기

For example, what is approximately the size of an uncompressed stereo audio file, the sound time of which is one minute at a sampling frequency of 44.1 kHz and a resolution of 16 bits? The answer is as follows:

44,100 samples/second * 16 bits * 60 seconds * 2 channels = 84,672,000 bits = 10.584 MB


Clipping

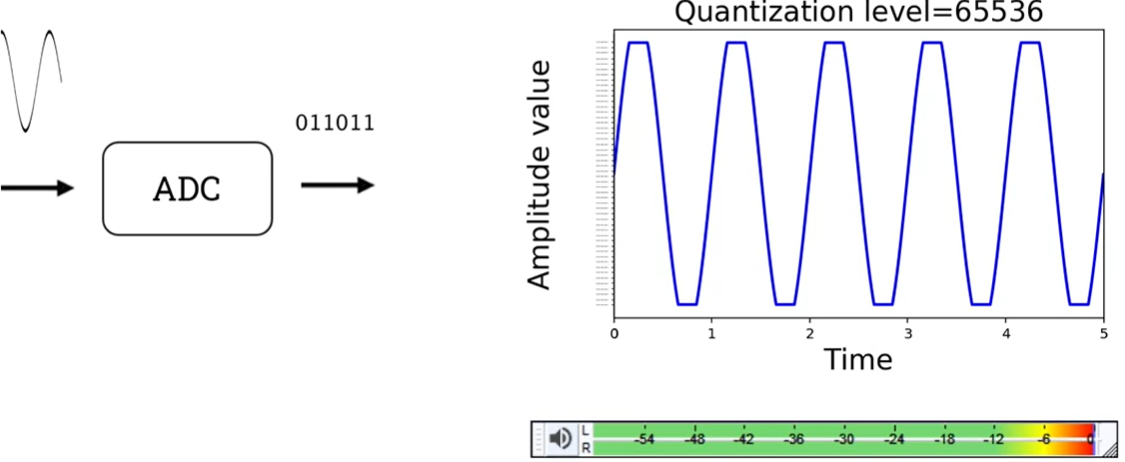
Clipping occurs in an ADC when the analog input signal exceeds the converter's maximum capacity. This overload forces the ADC to assign either the maximum or minimum digital value to affected samples, resulting in a flat-topped or flat-bottomed waveform. This distortion is undesirable and should be avoided. If the level meter reads zero (or the clipping indicator turns red), this means the signal is clipping!


Digital audio representation

All these processes generate an array of samples that we can use to create a new file to process the audio in real-time in the computer, to store the data in a CD, etc. There are two ways of representing digital audio:

1. The time domain representation gives the amplitude of the signal at the instance of time during which it was sampled.

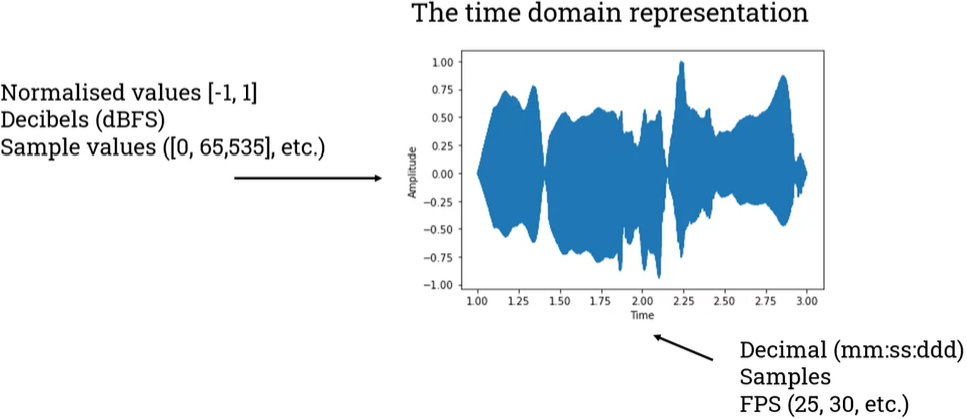
  • Time can be expressed as a decimal format. It can also be expressed in terms of samples, for example, we have seconds in the graph.
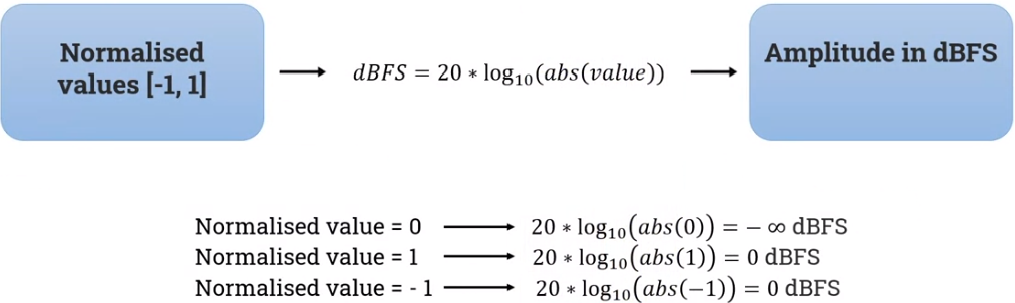
  • Amplitude has normalised values between 1 and -1. In using the normalised values, we can find programs that in decibels or even in the sample values.

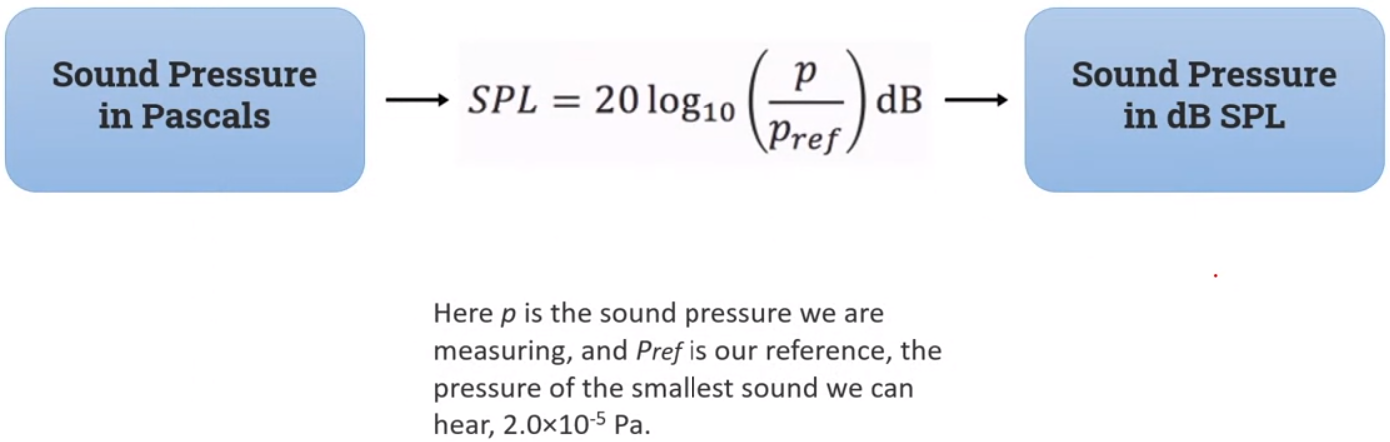
We can use decibels to represent the values of the samples, but that is not the same as dB SPL. dB FS stands for decibels Full Scale.

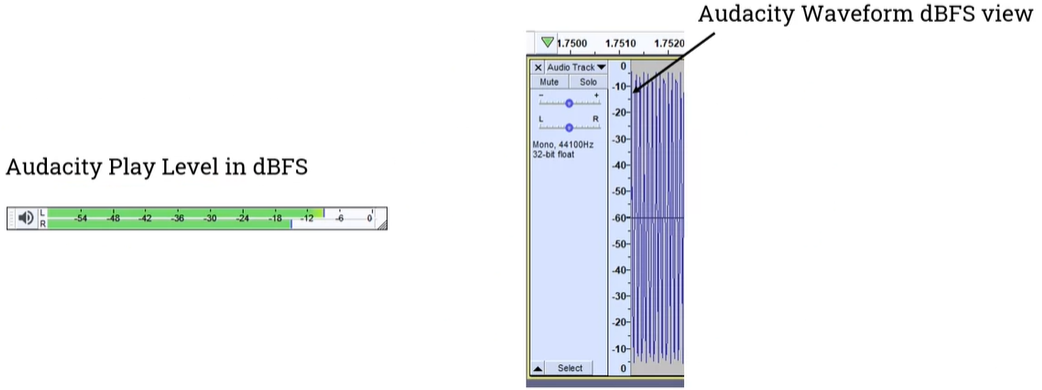
  • For example, in Audacity, the meters are in decibels that go from zero to minus infinite.

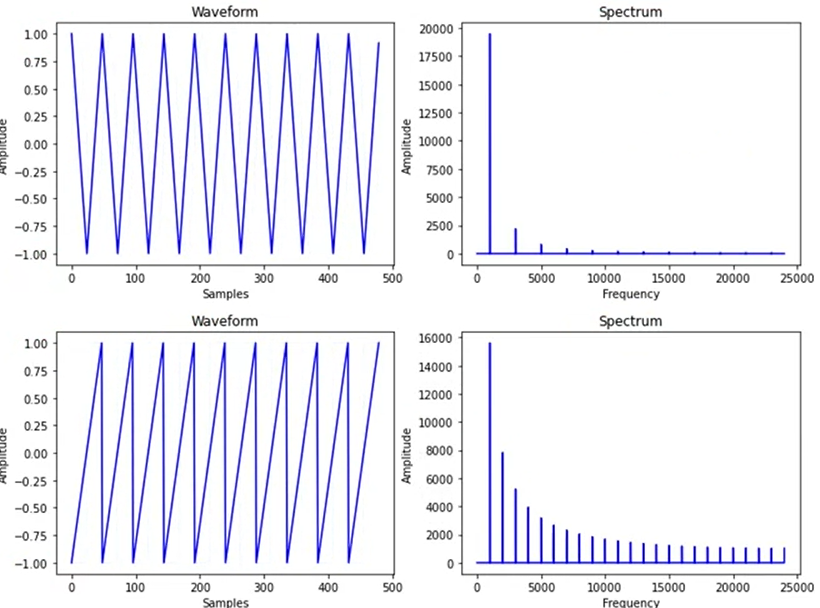
2. The frequency domain gives us information about the frequencies of a sound (sounds can be composed of millions of frequencies as they don't just have one frequency).

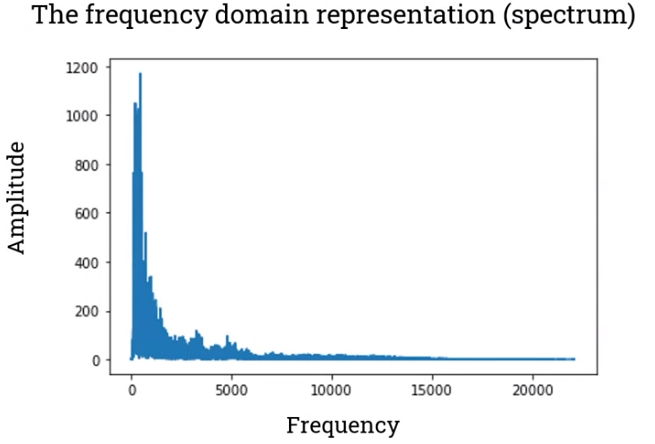
A spectrogram is a visual representation of the spectrum of frequencies of a signal as it varies with time.

A spectrogram is very similar to the frequency domain representation, but it provides more information about the time-varying nature of vibration, while frequency domain analyses provide information at a specific moment or as an average over time.

'IntelligentSignalProcessing' 카테고리의 다른 글

(w10) Offline ASR (Automatic Speech Recognition) system  (0) 2024.06.11
(w06) Complex synthesis  (0) 2024.05.14
(w04) Filtering  (0) 2024.05.01
(w03) Audio processing  (0) 2024.04.26
(w01) Audio fundamentals  (0) 2024.04.11

What is SOUND?

  • In terms of physics, sound is a form of energy produced by vibrating matter.
    • Sound is mechanical energy that needs a medium to propagate.
    • Sound can travel through a medium which is solid, liquid or gas.
  • In terms of physiology and psychology, sound is the reception of these sound waves and their procession by the brain.
    • Sound waves arrive through the ears of the receptor.

A sound wave is generated by some vibrating source, propagates through a medium as a series of compressions and rarefactions, and is finally received by our ears and brain.


Characteristics of sound waves

  • Velocity
    • The speed of sound waves is NOT alwys the same.
    • A speed sound depends on the elasticity, density, and temperature of the medium the sound is traveling through.
      • For example, at 0 degree centigrade, the speed of sound in Hz (hertz) is about 331 m/s (meter per second).
      • Note that the MORE dense the material, the faster sound travels through it.
        Sound travels SLOWER through the air at 30 degrees because the air is LESS dense at 30 degrees.
  • Wevelength and Amplitude
    • What happens to the air molecules when making sounds? The vibration produces areas in which the particles are closer together and areas in which they are further apart. 
      • The vibration creates in the surrounding area a series of alternative high pressured regions called compressions (the region of air where the molecules have been compressed together) and low pressure regions called rarefactions (de-compressions) that travel away at a certain speed.
      • The air molecules vibrate back and forth, but they do not travel with the wave. Sound waves trafer energy but not matter. It means the wave energe travels in this direction (propagation), not the matter.
    • Sound waves can be represented as a function which ranges over particle density or pressure values across the domain of distance.
      • The wavelength of a sound wave is the distance between two successive crests (or troughs) of the wave.
      • The amplitude of a sound wave is the maximum change in pressure or density that the vibrating object produces in the surrounding air.
      • The pressure is measured in pascals (Pa). Although for practical reasons the dB SPL scale is usually used for measuring sound amplitude.
  • Frequency and Time Period
    • Frequency is the number of times per second that a sound pressure wave repeats itself. These repetitions are known as cycles. Frequency is measured in hertz (Hz) or cycles per second.
      • The diagram representing the upper wave contains more cycles per unit of time.
    • Time Period is the duration of H cycles. Time Period is the time a sound wave takes to go through a compression-rarefaction cycle.
    • Fomulas:
      • The period (T) is the inverse of the frequency (f):
        As the period gets smaller, the frequency gets larger, and as the period gets larger, the frequency gets smaller.
      • There is also a direction relation between sound speed (ν), wavelength (γ) and frequency (f):


In order to determine the properties for a given sound, it is useful to use the waveform view of sound. The waveform view is a graph of the change in air pressure at a particular location over time due to a compression wave. The waveform view is a physical representation.


Human sound perception

Physical properties Perceptual perperties
Frequency Pitch
Amplitude Loudness
Waveform Timbre
Wavelength  
Time period  
Duration  

What is the relation between the physical properties of sound and the psychological (or perceptual) properties of sound such as pitch, loadness, and timbre:

  • Pitch is the equality that makes it possible to classify sounds as higher and lower.
    • The physical property that is related to pitch is frequency.
  • Loudness is the quality that makes it possible to order sounds on a scale from quiet to loud.
    • The amplitude of sound waves is related to the perception of loudness.
  • Timbre, also known as tone colour or tone quality, describes those characteristic of sound which allow the ear to distinguish sounds which have the same pitch and loudness.
    • The waveform is related to the perception of timbre.

In order to use the physical waveform view to understand something about these perceptual properties, we need to identify physical properties that are related to them. However, this is not so simple!

  1. First, the relationship between the physical properties of a sound wave and the way we perceive it is non-linear. For example, a change in frequency does not always correspond with that constant change in pitch.
  2. Second, the way all these properties are related to each other is not so simple. For example, the frequency is rate to pitch, but the frequency also affects the loudness, the frequency also affects to the timbre, the amplitude affects to the pitch, the wave form affects to the pitch, the duration affects to the pitch and the timbre. In fact, all these properties are related to each other.

The basic concept for understanding processes such as the digitisation of a sound wave or the compression of a sound file:

  • Pure tone
    : Several experiments about human sound perception are based on pure tones. The real-world sounds are not pure tones. Pure tones can only be produced technologically.
     A pure tone is a sound that can be represented by a sinusoidal waveform that is a sine wave of constant frequency, phase-shift, and amplitude. It is composed of a single frequency.

Perception of pitch

Frequency is perceived by humans as speech.

  • A high frequency sound wave corresponds to a high pitch sound.
  • A low frequency sound wave to a low pitch sound.

As described in the figure above, the relationship between pitch and frequency is not as simple linear one for frequencies above 1,000 hertz, greater change in frequency is needed to produce a corresponding change in pitch.

  • There are a wide range of frequencies that occur in the world, humans cannot hear all the sound waves that arrive to our ears. The frequency range of human hearing is about 20 to 20,000 hertz.

Perception of loudness

Loudness is a sensation related to the amplitude of sound waves.


To express sound amplitude in terms of pascals, we have to deal with numbers from as small as 20 to as big as 20 millions.

Our ears perceive sound intensity on a logarithmic scale, which is why sound pressure is measured in decibels (dB), specifically dB SPL (decibels of sound pressure level). This logarithmic scale makes more sense for our hearing than a linear one. The formula expresses sound pressure in dB SPL. For example, we have a sound pressure of 20,000 micropascals.

$$ SPL=20log_{10}(\frac{2,000}{20})dB=20*3=60 $$

Dividing this by a reference pressure (usually 20 micropascals) gives us 1,000. Taking the logarithm (base 10) of 1,000 and multiplying by 20 (because we're using the dB scale) gives us approximately 60 dB SPL.

The relation between the subjective quality of loudness and the physical quantity of sound pressure level is complex. This graph is called an equal loudness contour and it shows the sound pressure level required at different frequencies to achieve a consistent perceived loudness. Each curve on the chart represents a curve of equal loudness of pure tones. Two important things are:

  1. The ear is more sensitive to high-mid frequencies than to bass frequencies. In general, humans can hear sounds at lower decibel levels between 3000 and 5000 hertz than any other frequency.
  2. The human ear interpret changes in loudness within a logarithmic scale.

The quietest sound we can possibly hear is given as 0 dB SPL and is referred to as the threshold of hearing. The "0" does not mean that there is no pressure in the sound wave. The loudest sound that we can hear is approximately 120 dB SPL and is referred to as the threshold of pain. Anything above this is both physically painful and damaging to our hearing.


Perception of timbre

Timbre or tone quality is what differentiates two sounds of the same frequency and amplitude.

  • The two sound graphs have the same frequency and amplitude, yet they differ. They have different timbre!

The perceptual property of timbre is related to the physical properties of the waveform and the spectrum of sound. Timbre is influenced by the shape of the waveform as well as the spectral characteristics. For instance, the spectrum of a pure tone contributes to its timbral qualities.

These are other waveforms. All of them are similar, but all of them are different. They have the same amplitude and the same frequency, but the sound is different because they have tone quality or different timbre.


'IntelligentSignalProcessing' 카테고리의 다른 글

(w10) Offline ASR (Automatic Speech Recognition) system  (0) 2024.06.11
(w06) Complex synthesis  (0) 2024.05.14
(w04) Filtering  (0) 2024.05.01
(w03) Audio processing  (0) 2024.04.26
(w01) Digitising audio signals  (0) 2024.04.11

+ Recent posts